Two live embeds. No data feed to maintain.
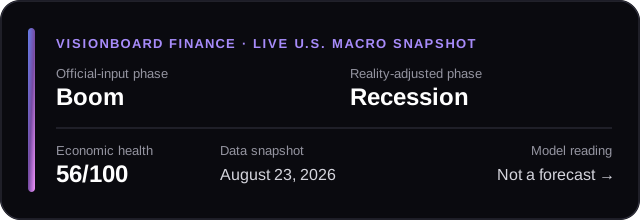
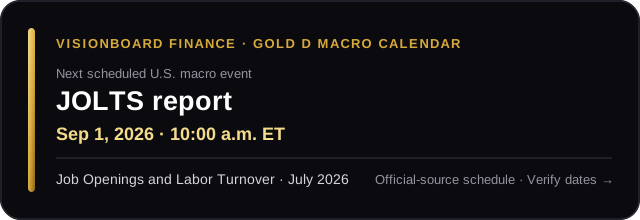
Use the market-cycle badge for a current model reading or the macro-calendar badge for the next scheduled CPI, PPI, PCE, jobs, JOLTS, retail-sales, GDP, or FOMC event. Both link readers to visible sources and limitations.
Current market-cycle reading
Next U.S. macro event
Clear reuse terms
- Use either badge free of charge on a public website or newsletter archive.
- Keep each badge linked to its included VisionBoard Finance page so readers can inspect sources and limitations.
- Do not alter a reading or date, remove its limitation label, or imply that VisionBoard endorses a security, trade, or forecast.
- Do not use either badge in individualized investment advice or as a substitute for your own source review.
For a custom size, an editorial question, or a data collaboration, email support@visionboardfinance.com. Include your publication URL and intended use.
One share card. Three ready-to-review captions.
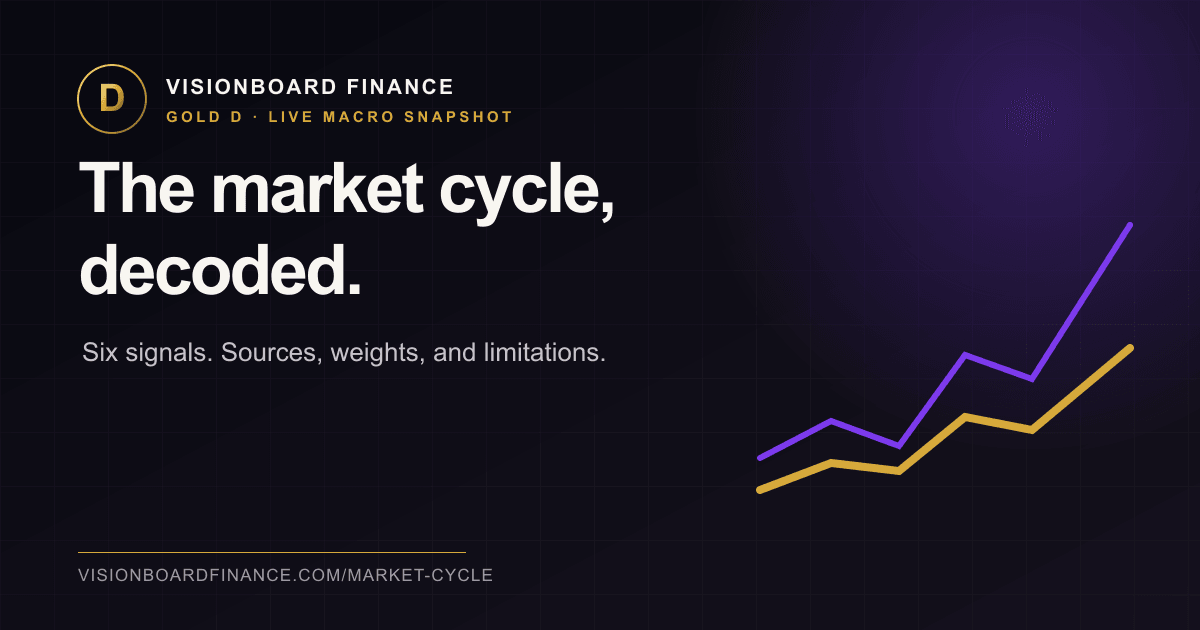
Download the 1200×630 market-cycle card, then copy the caption that fits your channel. Each caption states what the page contains without calling the model a forecast. Copied captions append a tracked link and preserve a valid publisher code from this kit URL.
Concise social
One macro headline is not a cycle call. This six-signal market-cycle page shows its sources, weights, current reading, and limitations.
Explanatory social
What changes when official economic inputs and a reality-adjusted reading diverge? VisionBoard Finance lays out six signals, their weights, source dates, and the limits of the model before presenting a cycle label.
Newsletter citation
Reader resource: a source-aware U.S. market-cycle dashboard that separates its official-input phase from its reality-adjusted phase. The methodology, component weights, timestamps, and “not a forecast” limitation are visible on the page.
More source-backed assets
Use a copy-ready link when an embed is not a fit. If this kit URL includes a valid partner code, every copied link preserves that publisher attribution; otherwise it uses the general publisher-kit source.
CPI inflation calculator + annual history
Calculate purchasing-power changes from the official BLS CPI series and cite the 1913–2026 annual history or downloadable CSV.
CPI release calendar + share card
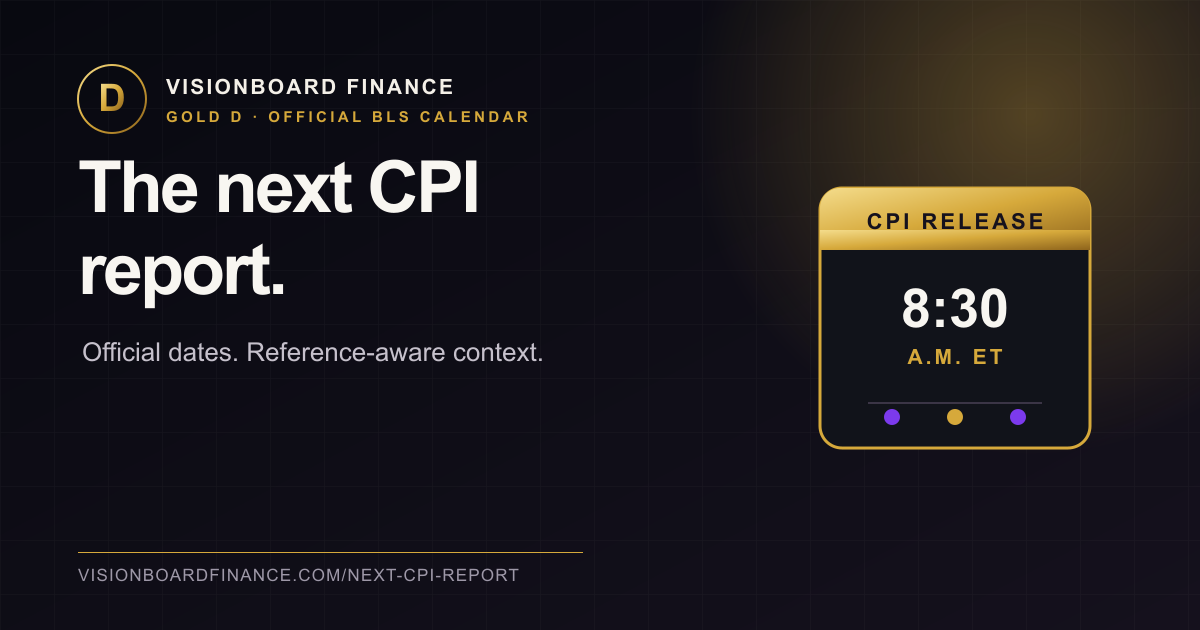
Give readers the next official BLS release date, reference month, interpretation checklist, and a 1200×630 citation card.
Complete U.S. economic calendar
Official CPI, PCE, jobs-report, GDP, and FOMC dates in one release-aware calendar.
Downloadable macro calendar
A calendar file with all embedded 2026–2027 release dates for readers who want reminders.
10Y–2Y yield-curve calculator
Transparent Treasury-spread arithmetic with FRED context and explicit interpretation limits.
Days-to-cover calculator
FINRA-defined short-interest-ratio math with shareable inputs and source cautions.
For individual release pages, link directly to the CPI calendar, PCE inflation calendar, jobs report calendar, GDP calendar, or Federal Reserve meeting calendar. Follow new public analysis through the RSS feed.